Since January 15, 2019, students taking USMLE Step 1 (and Step 2 CK) have received a new score report. What changed – and why?
If you’re interested in the party line, you can read it here.
If you’d prefer to compare the reports yourself and come to your own conclusion, read on. (And if you’d like to compare the reports yourself and read my conclusion, then just read on a little further.)
The old report
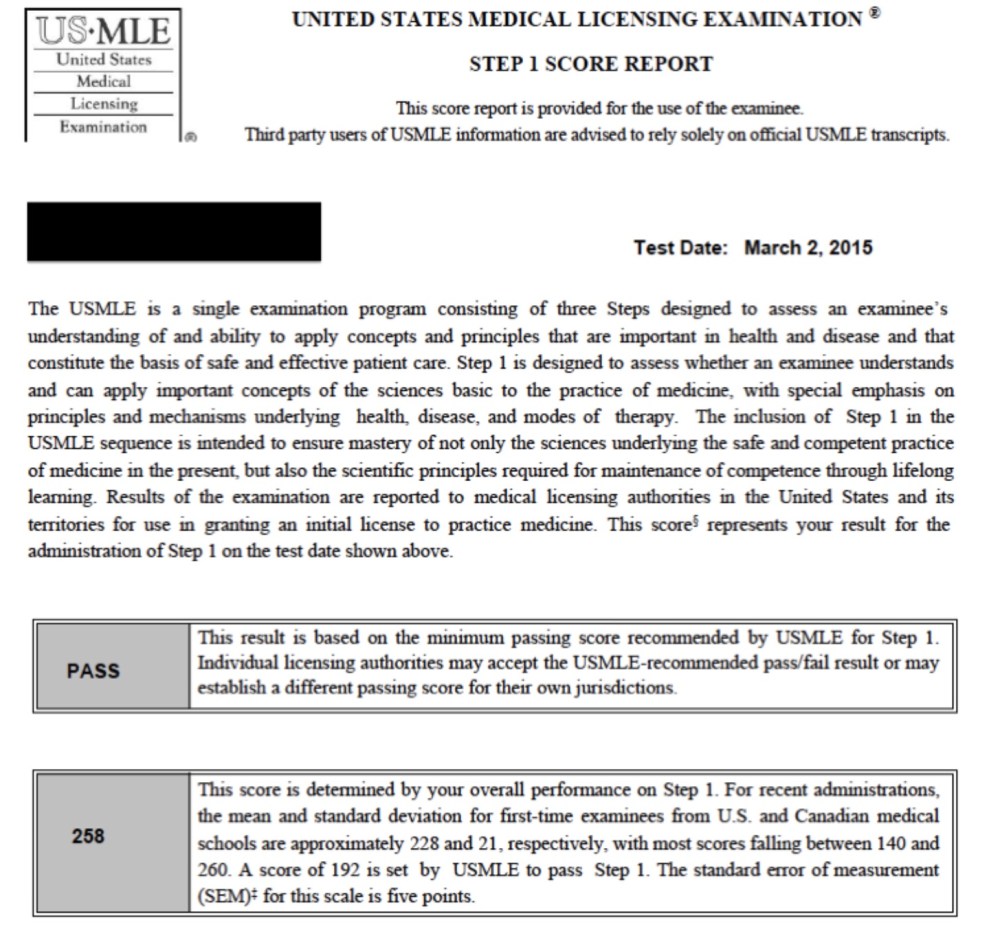
Here is a screenshot of an old USMLE Step 1 score report. Notice the information contained and the way it is presented.
The new report
And here’s a screenshot of the new report.
(This came from the USMLE website, and although the sample shown is for USMLE Step 3, the Step 1 and Step 2 CK reports use this same format.)

Can you spot the differences?
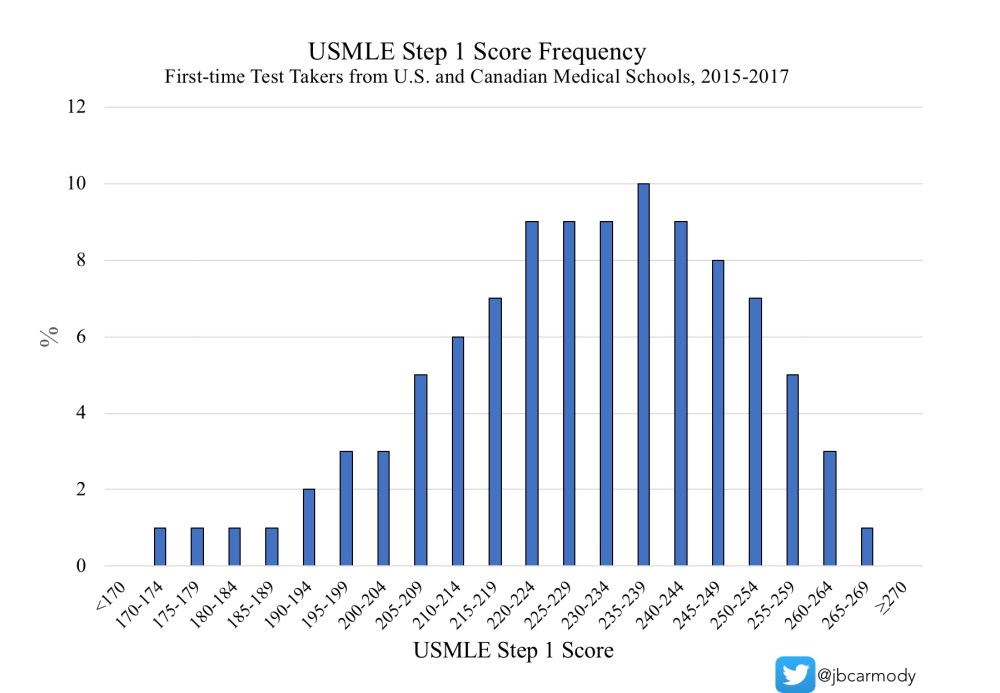
You don’t have to be a Spot It! champion to see that there is one piece of new information being emphasized in the new report. The largest portion of the new report is filled up with a colorful new infographic: a histogram of other examinees’ performance.
It’s not as if this information used to be secret. The histogram is new, but a chart with score percentiles has been available for years on the USMLE website. You just had to go looking for it.
So why the change? Why bring this information front and center now?
Before answering that, I’d first like to answer a more fundamental question. Why report numeric scores for the USMLE in general?
The rationale for reporting numeric scores
Remember, the USMLE is a licensing examination. Licensure is a binary outcome: a candidate is either competent for licensure or not. Why do we need a score at all?
Historically, at least, the reason the NBME has chosen to report scores is the belief that students benefit from this feedback.
Consider, for example, the sentiment expressed 82 years ago in an NBME publication:
A mere distinction between passing and failing may satisfy the poor student, but even the mediocre student is entitled to know how far he escaped the noose.
-Howard T. Karsner (1937)
Similarly, when the NBME reviewed their score reporting policies in 1990, they concluded they have “an obligation to provide examinees with knowledge of how their performances compare with the passing scores.”
Students feel the same way. In a survey conducted by the NBME in 2000, 78% of students wanted to receive numeric score reports – even though a majority of students preferred pass/fail score reporting to residency programs.
For the record, I also agree with this rationale. Students deserve some understanding of how well they’re meeting the bar that has been set for them. (Tests like Step 2 CS, where the pass/fail determination emerges out of a black box, have been rightfully criticized for not providing this type of feedback.)
On to page 2
Toward this end, the second page of the old score report included a graphic similar to the one below, demonstrating how the examinee performed against the test standard in various content areas.
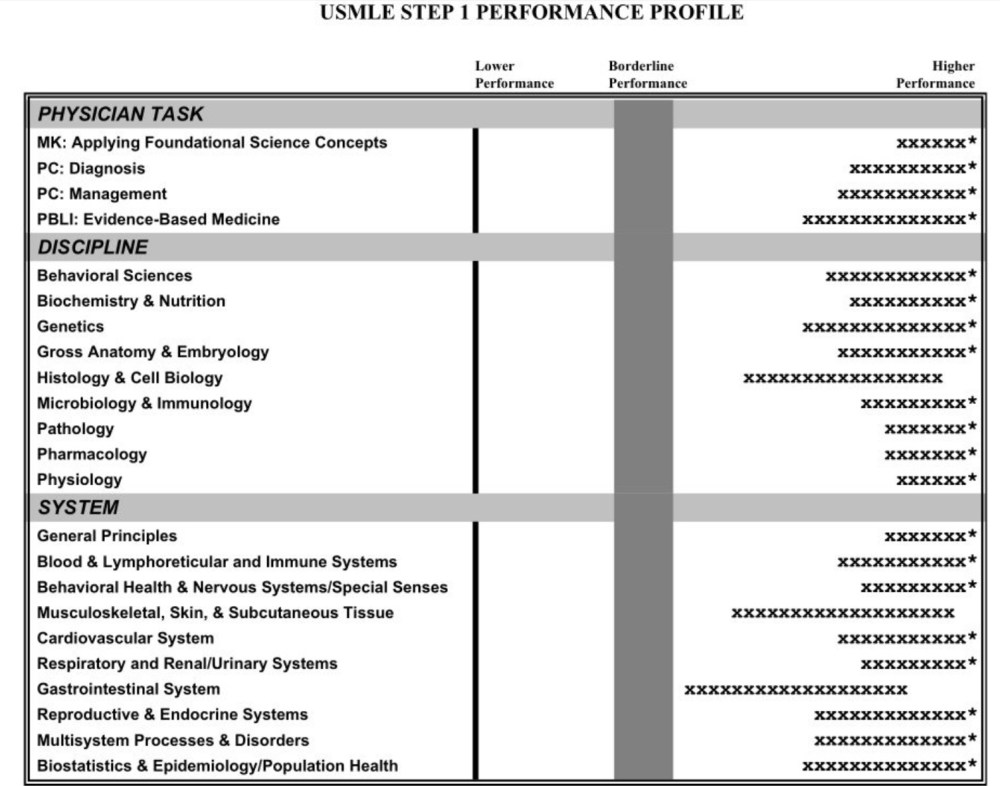
__
On the new score report, this information is reported somewhat differently.
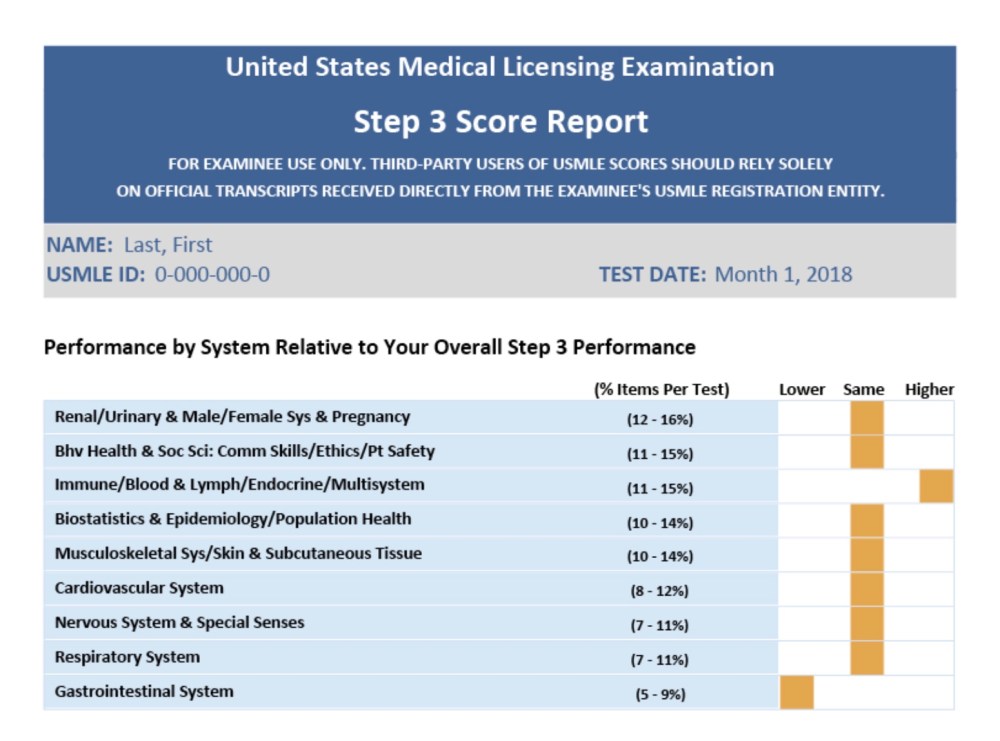
__
At first glance, this may appear to show the same information as the old score report. However, there is a subtle – but important – difference.
The old score report demonstrates subject area performance in absolute terms. Want to know how far you “escaped the noose”? It’s easy to see. The test’s objective standard is marked, and you can see how far you are above it. (The examinee above performed comfortably above the standard in each subject area.).
The new report shows the subject area performance relative to the examinee’s overall performance. In other words, unless the examinee passes the standard by exactly the same measure in every single category, the new report will highlight some areas of weaker performance.
Why make these changes?
Not everything about the new score report is bad. The inclusion of confidence intervals (at the bottom of the first page) is a nice touch, as these are useful in appropriately interpreting the Step 1 score.
But what about the other changes? Why were they made?
Remember, there are two significant changes in the new USMLE score report:
- Page 1 now includes a histogram, so that there is no doubt about exactly where an examinee’s score falls relative to his or her peers.
- Page 2 now presents subject area performance not against the objective exam standard, but relative to the examinee’s overall performance.
In other words, if you took Step 1 on or after January 15, 2019, the NBME doesn’t just want you to know your score, or whether you passed or failed. They want you to know exactly how you stack up with your peers. And regardless of by how much you exceeded the passing standard, they want you to know that you could score higher.
Why? The NBME notes that they were responding to student feedback in making these changes, and that “examinee focus group results clearly demonstrated that the new score report format was viewed as a substantial improvement by USMLE test-takers.”
I believe it.
Step 1 Mania
We are fully in the grip of “Step 1 Mania.” Scores each year are rising, because we’ve chosen a system where the USMLE Step 1 score is the single most important discriminating factor in residency selection. Accordingly, each year students spend more and more time in Step 1 prep – at the expense of more beneficial educational activities.
A few days ago, a student Tweeted this to me:
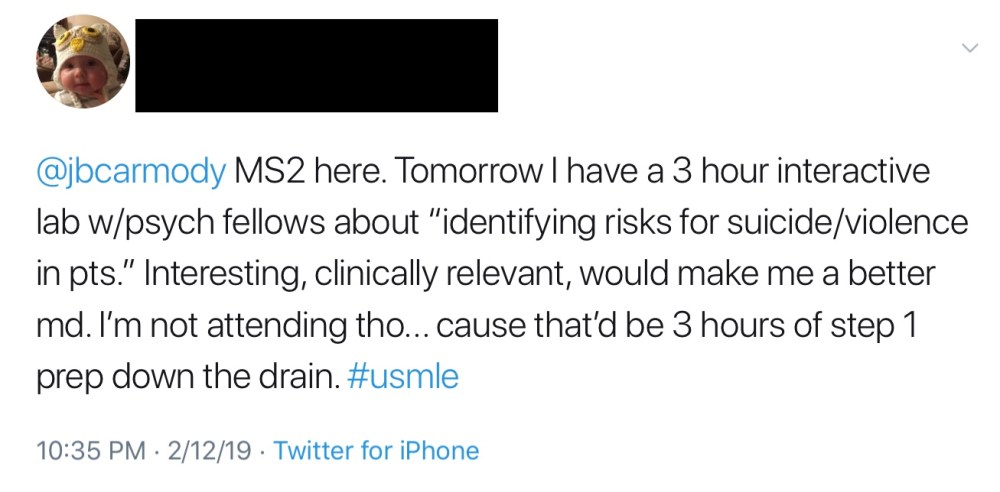
This comment is noteworthy only for its brutal honesty – the underlying sentiment is commonly expressed by medical students in schools across the country.
Step 1 Mania puts students in an impossible position. Although a student’s future patients might benefit from their attendance at the aforementioned lecture, it’s a moot point unless they memorize enough irrelevant basic science trivia to catch the attention of a residency program in their chosen discipline. It’s easy for faculty to blame the students – but they are rational actors in the irrational tragicomedy into which we have inserted them.
Although the decision to report Step 1 scores has been historically justified as helpful to students, the new changes have nothing to do with student benefit, and everything to do with the NBME seizing an opportunity to subtly fan the flames of Step 1 mania.
As I have discussed previously, the USMLE is a criterion-referenced test. It is specifically designed to ensure that examinees meet an objective minimum knowledge standard. It is not a norm-referenced test. Thus, there is absolutely no need to show a bell curve of overall examination performance: one examinee’s performance has nothing to do with the performance of his or her peers.
Similarly, since the test is designed to discriminate the minimal acceptable level of competence, reporting relative areas of ‘weakness’ that well exceed that standard is somewhat dubious – unless the intent is to remind students that regardless of whether they passed, and regardless of their score, they could have scored higher.
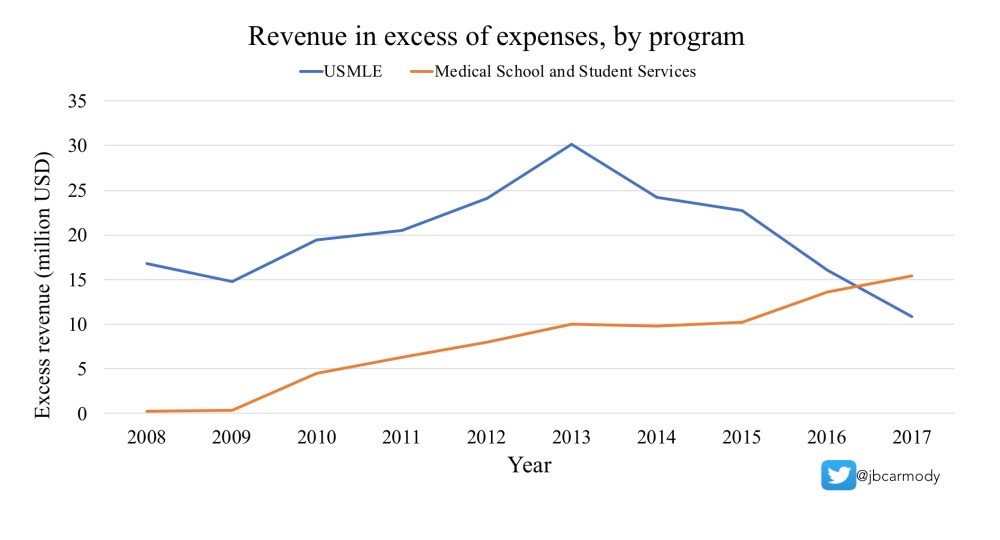
The rise of “Step 1 Mania” has benefitted no one more than the NBME – and their executives have a strong financial incentive to continue stoking the flames. As I have pointed out before, the NBME now derives more profit from sales of self-assessment exams and associated services than they do from the USMLE itself.
My beef here is not with the new score report.
It’s not with students for requesting it.
It’s with the NBME, an organization with a catholic purpose that has chosen to function like a for-profit entity, and is willing to turn a blind eye to a broken system so long as it keeps generating more revenue. And it’s with medical educators and residency directors, who witness the harms of Step 1 on a daily basis and yet choose to do nothing.
Folks, we need more than just a new score report. We need to re-evaluate our priorities in both education and residency selection. Step 1 Mania is rotting medical education from the inside out. We don’t have to be okay with this – but if we want things to change, we have to speak up.
