
There’s a certain magic associated with the USMLE score.
This magic stems largely from our foolish idolatry of the three-digit score in residency selection, in which the difference of a few points can become a career-defining turning point. But it’s also because – just like with all good magic tricks – there’s a certain sleight of hand involved.
See, no one seems quite sure how the USMLE determines the three-digit score. Is there a “curve”? Are certain questions worth more than others? How many questions can you miss and still score 2xx?
Speculating on just how the USMLE score gets calculated is a cottage industry for many medical students, and has launched the careers of many a Redditor or Student Doctor Network-er.
Of course, unless this is your first time on this site, you’ll know that I often find this kind of magic distasteful. But it’s magic nonetheless.
And while a good magician never reveals his secrets, today it’s time to pull back the curtain and clarify the general method involved in calculating the USMLE three-digit score.
–
Why do we need a three digit score?
But first, we have to answer some foundational questions. The most important is this:
Why does the USMLE use a three-digit score, anyway?
I mean, why can’t they just report the results of the USMLE as the percentage of items that each test-taker got right, just like your high school teachers did?
For most tests, reporting the raw score – the absolute number (or percentage) of question items that the examinee answered correctly – is the simplest and most informative way to show results.
The nice thing about raw scores is that they’re easily interpretable.
Suppose we have two students, Student A and Student B, who each take a test. The test has 20 questions, and Student A answers 16 items correctly, while Student B answers 15.
If we want to compare Student A to Student B, it’s easy to do. In fact, we can do it a glance, without any advanced arithmetic. By simply glancing at the percentage of items that each student answered correctly, it’s easy to appreciate who scored higher, and by how much the examinees’ performance differed.

When students take the exact same test, it’s easy to decide whose performance was better.
Raw scores are great as long all examinees take the same test. That’s not a problem if you’re talking about a high school English class. But for large scale, high stakes exams like the USMLE, using the same test questions simply isn’t possible. Exam content and format changes over time, and test security requires that examinees take different forms of the test. (Trust me, if the USMLE used the exact same questions year to year, every test taker would score a 300.)
Unfortunately, using different versions of the exam requires using test forms that are not completely equal in difficulty. Therefore, when students take different forms of the exam, it can be challenging to figure out how to compare one student’s performance to another’s, as shown in the example below.

Student A has a lower raw score – but also took an harder version of the test. So whose performance is better?
To allow direct and fair comparisons of test takers across different forms of the exam or over time, we need to transform the raw score into something else.
–
The standard score
The easiest way to transform the raw score into a more-easily understood metric is to convert it to a z score.
The z-score will be familiar to anyone who has taken an introductory statistics course. It’s a way of showing how far an observed value lies from the mean of that distribution. The z-score is expressed in standard deviation units, and for most practical purposes, ranges from -3 to +3.
So let’s go back to our example.
Suppose Student A took a version of the exam where the overall mean was 60%, while Student B took an exam where the mean was 75%. Because the two exams differ in difficulty, we’ll use the z-score to figure out which student scored higher relative to the other takers of the same exam.
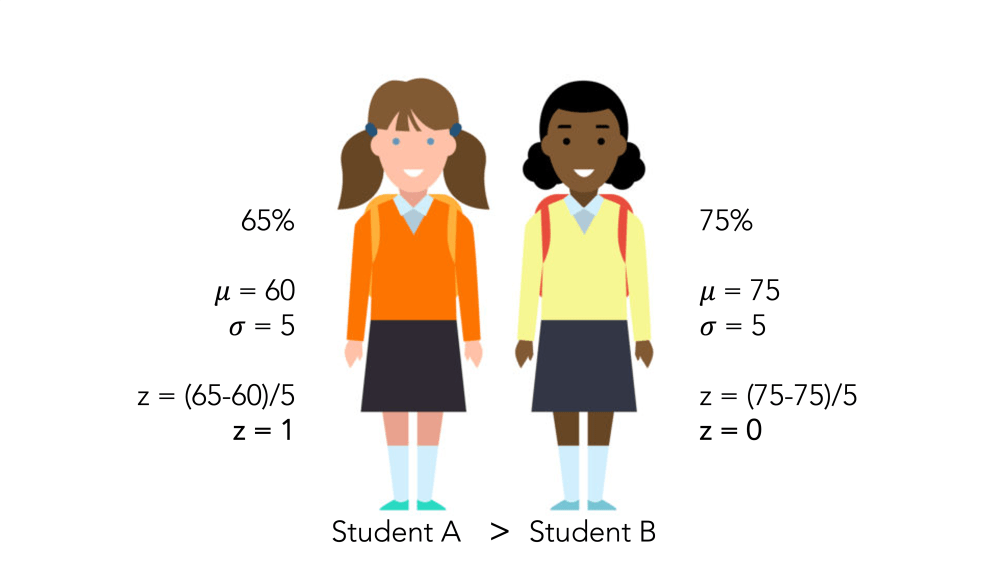
Even though Student A answered fewer questions correctly, her standard score is higher than Student B, who took an easier form of the exam.
Still, z-scores aren’t perfect.
Since scores below the mean generate a negative z-score, around half of all examinees end up with a score less than zero. Students don’t appreciate that kind of thing. It stinks to score a 200 on USMLE Step 1 – but imagine instead that you had to report a score of -1.2.
Therefore, most high-stakes tests – including the USMLE – use a different form of the standardized score: the T-score.
The T-score is just a linear transformation of the z-score. Classically, the T-score has a standard deviation of 10 and a mean of 50, and is calculated as
T = (10)(z) + 50
However, you can create a T-score with any mean or standard deviation you want. And indeed, that’s exactly what most testing bodies do.
Your SAT score was a T-score, with each section set to have a mean of 500 and a standard deviation of 100. The MCAT score is also a T-score: each section has a mean set at 125 and a standard deviation of 3 points, resulting in a mean of 500 and a standard deviation of around 10 for all four sections. (Of course, if you took the MCAT in the old days, like I did, they used a different T-score, resulting in an overall mean of 25 and a standard deviation of around 6.)
And the USMLE three-digit score is also just a T-score, set originally to have a mean of 200 and a standard deviation of 20. (As I’ve discussed before, the mean score has increased substantially as time has gone by.)
–
The USMLE scaled score
In other words, all we have to to do to calculate the three-digit USMLE scaled score is perform some simple arithmetic, as shown below.
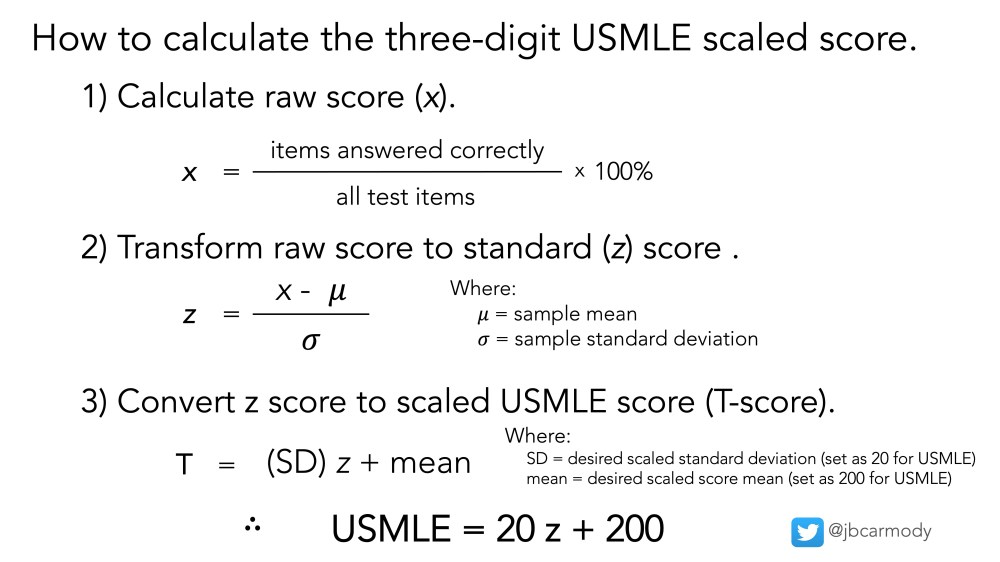
How the USMLE three-digit score is calculated.
Understanding the formula above allows us to dispel a couple of popular myths and half-truths about the USMLE.
–
MYTH: The USMLE is graded “on a curve.”
Ehhhh… not really.
Typically, grading on a curve means adjusting the observed raw scores of a test to fit a pre-specified distribution.
For instance, certain schools (most notoriously, law schools) limit the number of students who can earn an A to 10% of the class. If your score falls at the 11th percentile, then, you get a B – even if you were only a point behind those who got A’s, and 20 points better than the average student who earned a B. It should be apparent that the USMLE isn’t imposing a distribution like that.
On the other hand, the formulae above should clearly demonstrate that the three digit score is a function of both the examinee’s raw score and how that raw score compares to the performance of a reference group of examinees who answered the same questions.
For the USMLE, the reference group is a homogenous group of examinees (i.e., first-time test takers from U.S. MD schools) who answered the test items previously (for instance, as experimental items).
In other words, contrary to some often-repeated misinformation, your USMLE score doesn’t depend on who is taking the USMLE the same day that you are, and there is no pre-specified number of examinees that can achieve a certain score.
–
MYTH: Some questions are worth more than others.
All questions are worth exactly the same in calculating the raw score. And if two examinees achieve the same raw score on the same test form, they’re gonna get exactly the same three-digit score.
In theory, an examinee could answer all the hard questions right and the easy ones wrong and get the same score as someone who answered only easy questions correctly. In reality, this is highly unlikely to occur, which means that achieving a high score requires answering a certain number of very difficult questions correctly (and fuels the perception that some questions are worth more than others).
–
MYTH: To score a ___, you have to score __% of questions right.
This is more a half-truth than a myth.
The math is true: from the equations above, it’s clear that the raw score x can be determined for any given three-digit T score (and vice versa). To do so, all you’d need to know are the values to plug in for the reference group sample mean and standard deviation.
But unless you know these figures for the reference group, this calculation cannot be done precisely.
See, the USMLE reports only the overall exam mean and standard deviation (shown below). The sample mean and standard deviation for each individual exam form are figures that are closely held and unlikely to be shared outside of the confines of the NBME headquarters. So take the message board testimonials (“I scored 265 and got only 20 questions wrong!”) with more than a few grains of salt.
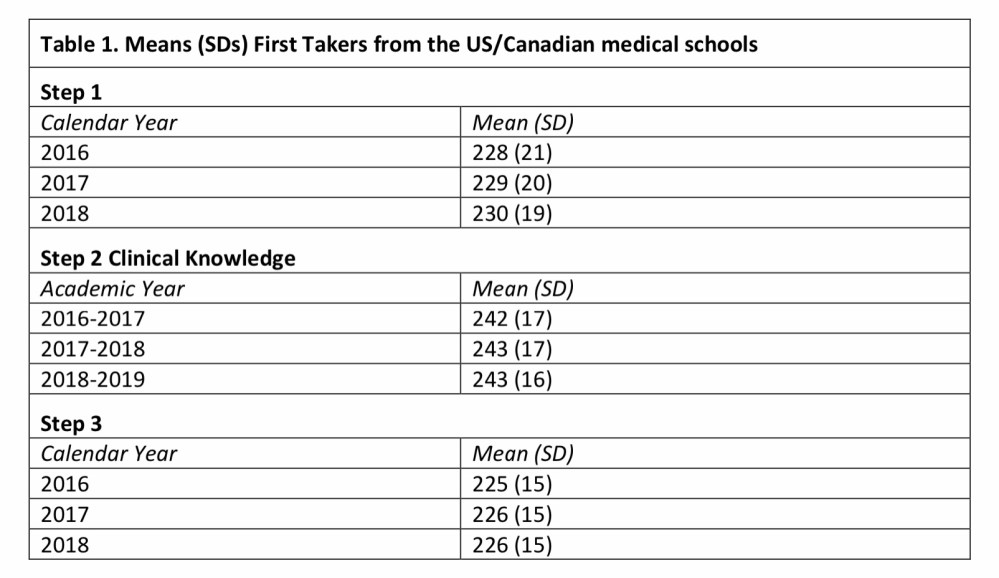
The USMLE Score Interpretation Guidelines report the overall mean and standard deviation for the Step 1, Step 2 CK, and Step 3 exams.
There is, however, one exception: the original USMLE exam.
When the USMLE began in 1992, there was no reference group to which to compare examinees’ scores. It was a new test. Instead, the NBME used first-time test-takers on the Comprehensive NBME Part 1 examination as the reference group, and because those values were published in the academic literature, it’s possible to reconstruct the raw scores-to-scaled score bell curve with confidence.
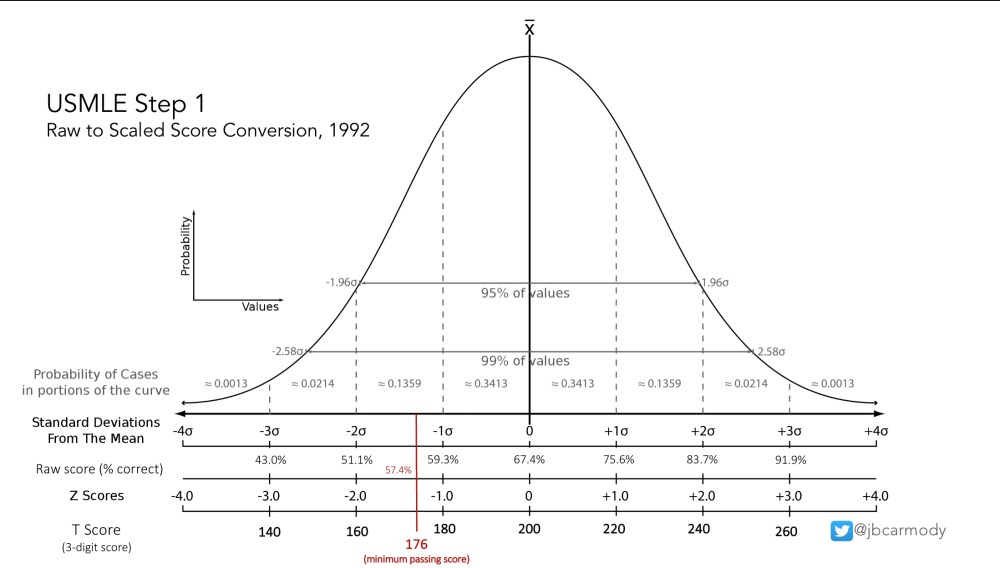
Raw score to scaled score conversion for the original USMLE Step 1 examination, 1992.
–
Now, if you didn’t take the USMLE in the early 1990s, you’re out of luck.
But in my opinion, that’s okay. Don’t be awed by the sleight of hand involved in creating the three digit score. We’d all be better off by recognizing it for the psychometric parlor trick that it is, and moving on.
–
YOU MIGHT ALSO LIKE:
Why Can’t I Re-Take USMLE Step 1?
